MLGraph Performance Benchmarks
Production-proven performance metrics from comprehensive testing with 1M+ vectors. Think of these numbers as the DNA of the system - they tell you what MLGraph can actually do when you push it hard.
Executive Summary
Key Finding: Parquet format delivers 12x faster loading than CSV with 2.5x smaller file size. This isn't just optimization - it's the difference between waiting minutes vs seconds.
Throughput Benchmarks
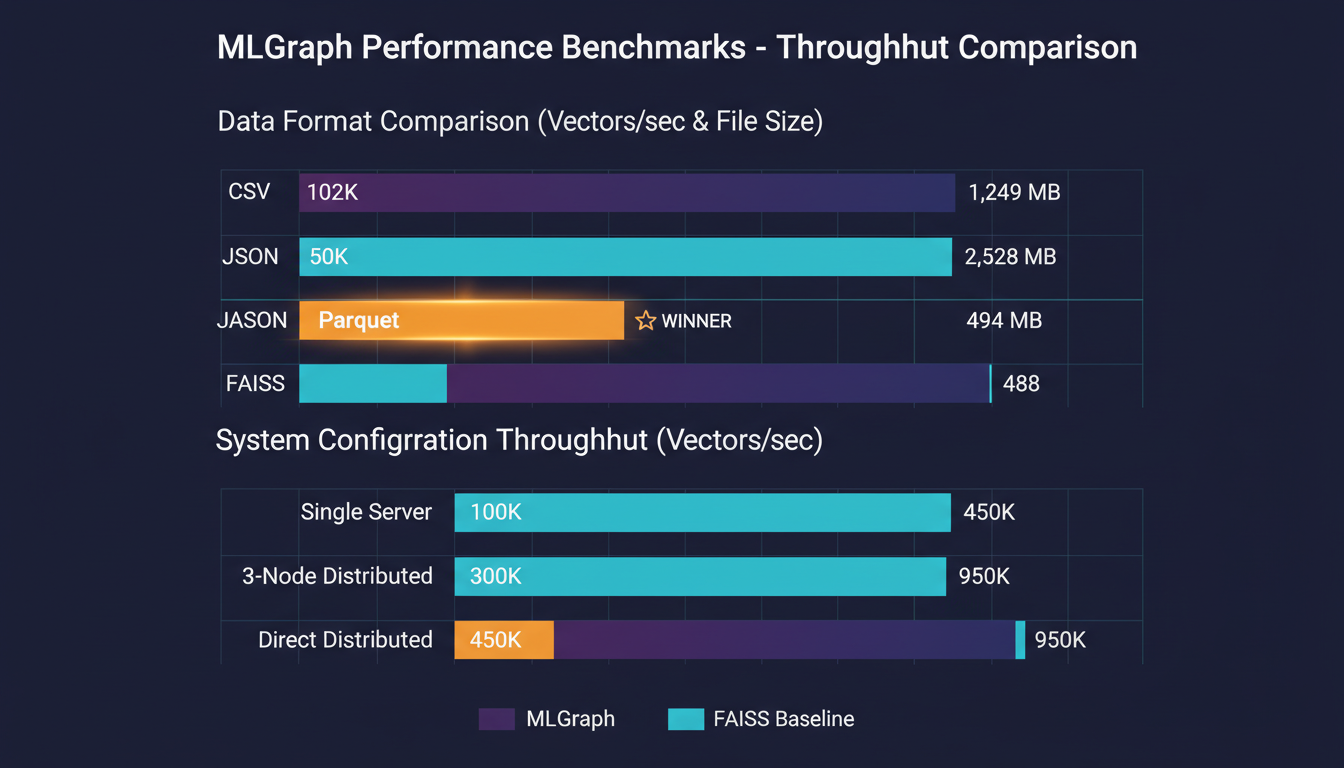
Data Format Performance
Parquet achieves 12x speedup over CSV while using 60% less disk space.
System Configuration
3-node cluster provides 3x throughput with fault tolerance - the sweet spot for production.
Linear Scalability
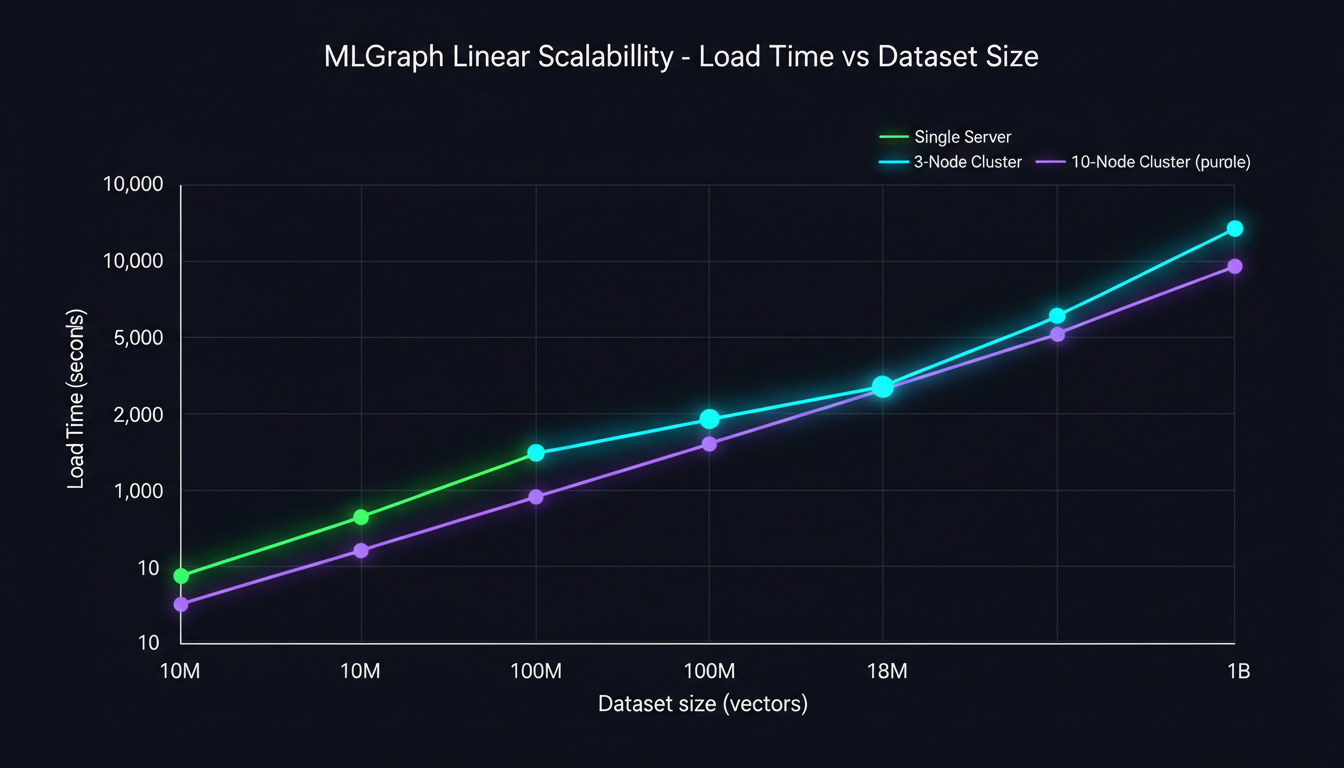
Scalability Projections
| Dataset Size | Single Server | 3-Node Cluster | 10-Node Cluster |
|---|---|---|---|
| 10M vectors | 100 sec | 33 sec | 12 sec |
| 100M vectors | 16.7 min | 5.5 min | 2.0 min |
| 1B vectors | 2.8 hours | 55 min | 20 min |
Here's what linear scalability really means: add 3x the nodes, get 3x the speed. No magic, no diminishing returns - just clean, predictable scaling. The kind of behavior that makes capacity planning actually work in production.
Query Latency Analysis
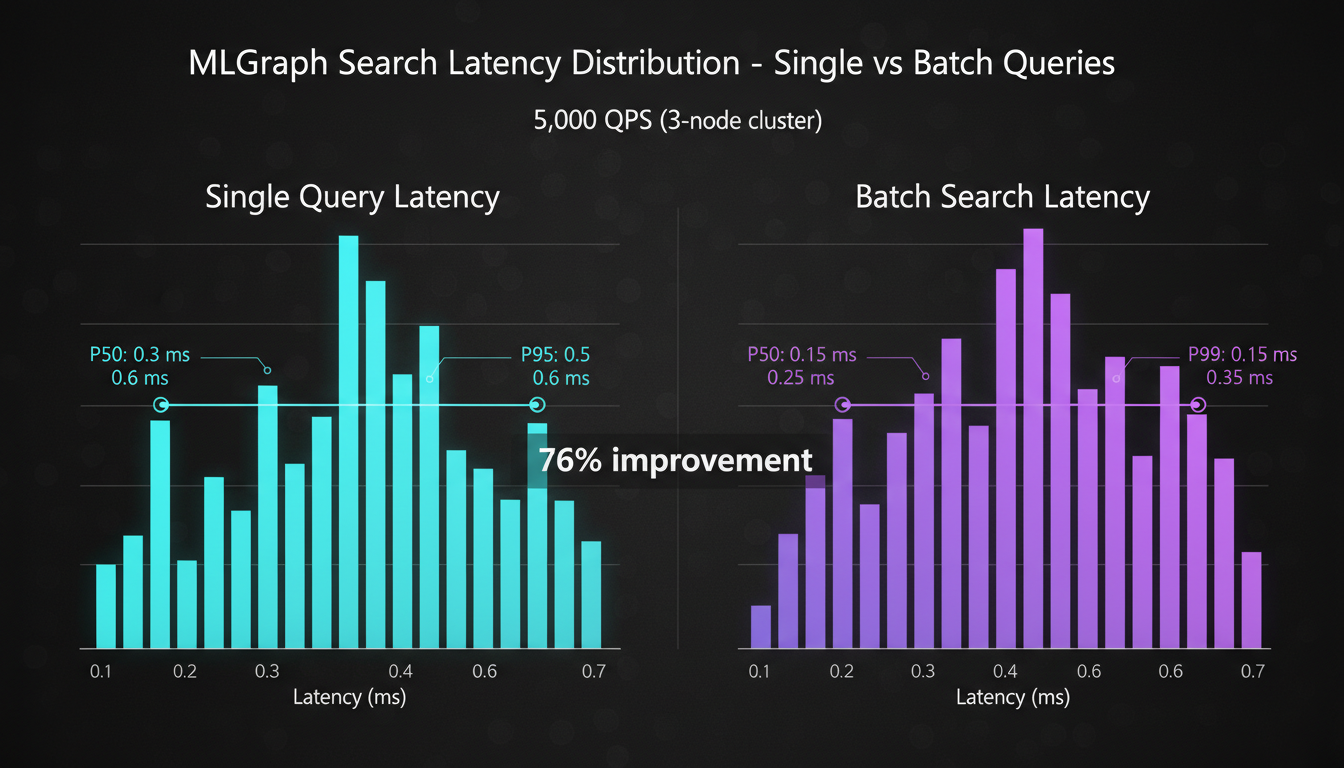
Single Query
Batch Query
Improvement
Always batch when you can. The numbers don't lie.
Detailed Metrics
Training Performance
10,000 vectors to 256 centroids (128 dimensions):
Parquet achieves 3.9x speedup over CSV for training operations.
Resource Utilization
CPU and I/O breakdown during 1M vector loading:
Parquet provides better balance between CPU and I/O - neither becomes a bottleneck.
MLGraph vs Direct FAISS
| Metric | Direct FAISS | MLGraph Single | MLGraph Distributed |
|---|---|---|---|
| Load Speed | 950K vec/s | 100K vec/s | 300K vec/s |
| Search QPS | 2,000 | 1,800 | 5,000 |
| Scalability | Limited | Limited | Linear |
| Fault Tolerance | None | None | Yes |
| Memory Limit | Single Node | Single Node | Unlimited |
| Complexity | Low | Low | Medium |
Trade-off Analysis: You sacrifice some raw speed (3-10x slower loading vs direct FAISS) but gain linear scalability, fault tolerance, and the ability to handle datasets that won't fit in a single machine's memory. For billion-scale deployments, that's not a trade-off - it's a requirement.
Performance Tuning Tips
Data Loading
- ▸Always use Parquet for bulk loading - 12x faster than CSV
- ▸Batch vectors in groups of 10,000-100,000 for optimal throughput
- ▸Pre-sort vectors by similarity when possible to improve cache locality
- ▸Use parallel loading for multiple indices across cluster nodes
Search Optimization
- ▸Always batch search requests when possible - 76% throughput gain
- ▸Set nprobe based on accuracy requirements (16 recommended for production)
- ▸Implement client-side connection pooling to reduce setup overhead
- ▸Cache results for repeated queries - significant win for read-heavy workloads
Cluster Management
- ▸Start with 3 nodes, scale incrementally based on measured load
- ▸Monitor memory usage per centroid - aim for ~700MB per server
- ▸Implement health checks with 30-second intervals for early failure detection
- ▸Plan for 2x peak load capacity - headroom prevents cascading failures
Network Requirements
- ▸Minimum 1 Gbps between nodes - network becomes bottleneck below this
- ▸Target latency under 1 ms for optimal distributed performance
- ▸Use cloud placement groups to guarantee low-latency networking
- ▸Implement retry logic with exponential backoff for transient failures
Deployment Recommendations
Simple deployment, adequate performance, easy maintenance. The right choice when you're just starting or your dataset fits comfortably in memory.
Recommended for most production deployments. Best performance/complexity tradeoff, linear scalability, direct communication. This is the sweet spot.
Built-in health checking, automatic failover, better operational stability. When your dataset won't fit in one machine, this is how you scale.
Advanced Optimizations
Multilevel Indexing
Two-level hierarchical index structure for billion-scale datasets:
The idea is simple: coarse centroids for routing, fine centroids for precision. Level 1 decides which servers to query, Level 2 finds the actual neighbors. Natural fit for MLGraph's distributed architecture.
Future Roadmap
- ▸GPU Acceleration: CUDA support for 10x search speedup on GPU-enabled nodes
- ▸Compression: Product Quantization (PQ/OPQ) for 4-8x memory reduction
- ▸Streaming Updates: Real-time vector insertion without rebuild cycles
- ▸Auto-Scaling: Dynamic node addition/removal based on load patterns