UI Feature
Three.js
3D Vector Visualization
Explore your vector space in three dimensions with interactive controls, real-time clustering visualization, and GPU-accelerated rendering.
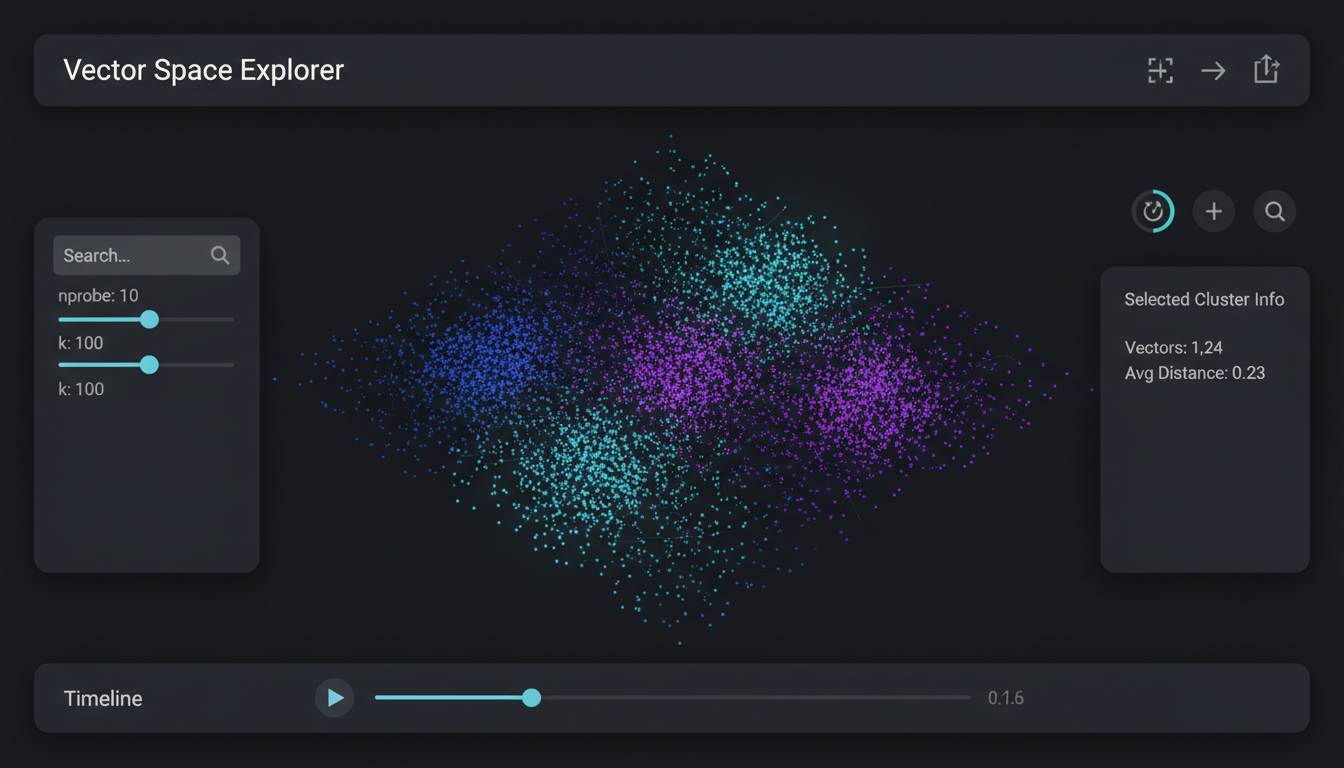
Interactive 3D scatter plot with cluster coloring and orbit controls
Overview
The MLGraph UI includes a powerful 3D vector visualization component built on Three.js. This allows you to explore your high-dimensional vector data projected into 3D space, see cluster structures, and understand the relationships between your vectors visually.
Key Features
Orbit Controls
Rotate, pan, and zoom through your vector space with intuitive mouse controls. Click and drag to orbit, scroll to zoom, right-click to pan.
Cluster Coloring
Vectors are automatically colored by their assigned centroid cluster, making it easy to identify groupings and outliers at a glance.
Level of Detail
Progressive rendering shows more detail as you zoom in. Distant vectors are simplified for performance, nearby vectors show full detail.
Selection & Inspection
Click on any point to see its full vector data, metadata, and nearest neighbors. Multi-select to compare groups of vectors.
Usage
Access the 3D visualization from any index page by clicking the "Visualize" button. The component uses PCA or t-SNE to project your high-dimensional vectors into 3D space.
Projection Methods
- PCAFast, linear projection. Good for initial exploration of large datasets.
- t-SNEPreserves local structure. Better for seeing cluster relationships.
- UMAPBalance between speed and structure preservation. Recommended default.
Code Example
import { VectorSpace3D } from '@/components/visualizations/VectorSpace3D';

// In your component
<VectorSpace3D
  vectors={vectors}
  labels={clusterLabels}
  projection="umap"
  pointSize={0.02}
  onSelect={(ids) => setSelectedVectors(ids)}
  colorScheme="spectral"
/>