Architecture
Operations
Distributed Health Monitoring
Continuous health checks across all nodes with alerting, status aggregation, and automatic remediation.
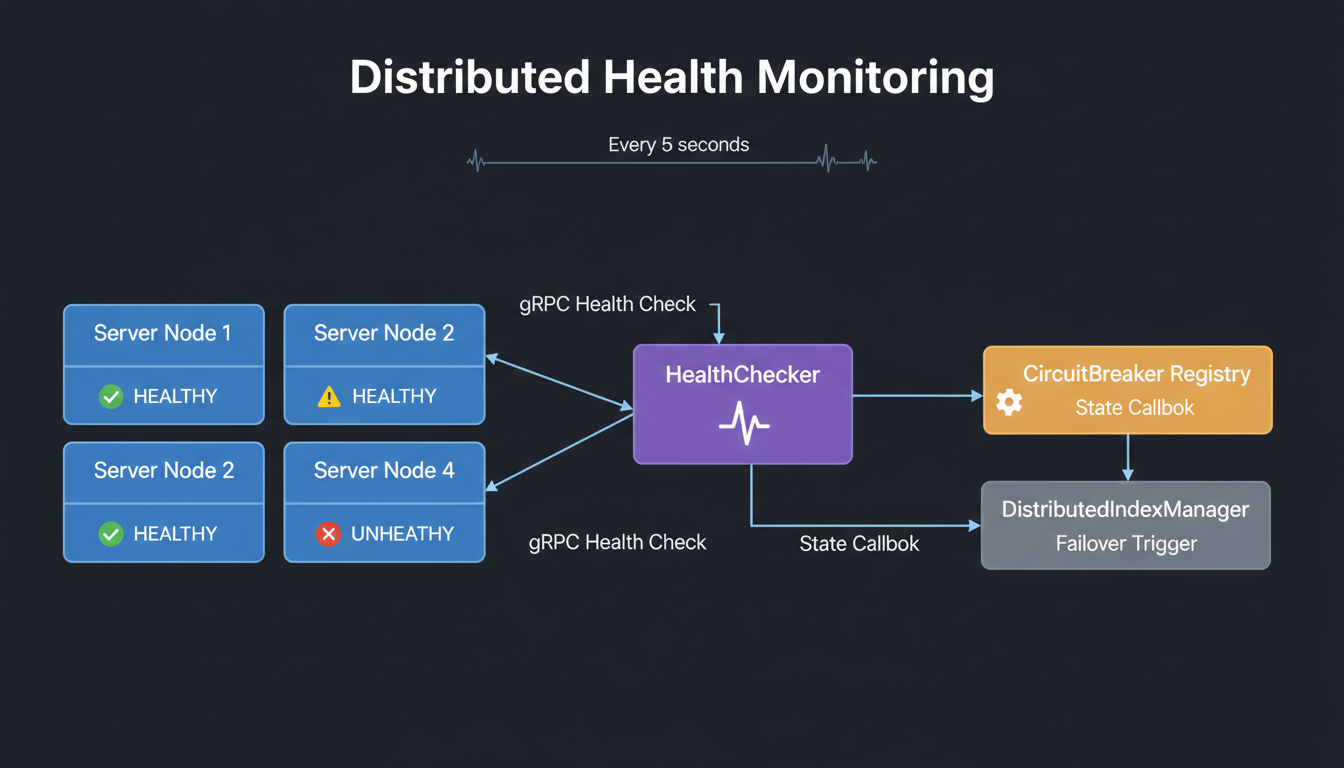
Health check flow across distributed nodes

MLGraph health discovery and service registration
Health Check Levels
Liveness
Is the process running and responsive?
- • Simple ping/pong
- • Fast (< 100ms)
- • Runs every 5s
- • Failure = restart pod
Readiness
Is the service ready to handle traffic?
- • Checks dependencies
- • Verifies data loaded
- • Runs every 10s
- • Failure = remove from LB
Startup
Has the service finished initializing?
- • Checks index loading
- • Verifies connections
- • One-time on boot
- • Failure = retry/abort
Deep Health
Comprehensive functionality verification.
- • Test search operations
- • Verify disk I/O
- • Runs every 60s
- • Failure = alert + degrade
DistributedHealthManager
// DistributedHealthManager aggregates health across nodes
class DistributedHealthManager {
  // Periodic health collection
  void collect_health() {
    for (auto& node : cluster_nodes) {
      auto status = node.get_health();
      node_health[node.id] = status;

      // Trigger callbacks on state change
      if (status != previous_health[node.id]) {
        for (auto& callback : callbacks) {
          callback(node.id, status);
        }
      }
    }
  }

  // Aggregate cluster health
  ClusterHealth get_cluster_health() {
    int healthy = 0, degraded = 0, unhealthy = 0;
    for (auto& [id, status] : node_health) {
      switch (status.state) {
        case HEALTHY: healthy++; break;
        case DEGRADED: degraded++; break;
        case UNHEALTHY: unhealthy++; break;
      }
    }
    return ClusterHealth{healthy, degraded, unhealthy};
  }
};
Health Status
| Status | Meaning | Action |
|---|---|---|
| HEALTHY | All checks passing | Normal traffic |
| DEGRADED | Functional but impaired | Reduced traffic, alert |
| UNHEALTHY | Not functional | Remove from pool |
| UNKNOWN | Cannot determine | Retry, then UNHEALTHY |
Alerting
Alert Channels
- Slack/Teams: Instant notification to ops channel
- PagerDuty/OpsGenie: On-call escalation for critical
- Email: Summary digests for degraded states
- Webhook: Custom integration endpoint
Endpoints
# Kubernetes probes
GET /health/live     → 200 OK / 503 Service Unavailable
GET /health/ready    → 200 OK / 503 Service Unavailable
GET /health/startup  → 200 OK / 503 Service Unavailable

# Detailed health (for dashboards)
GET /health
{
  "status": "healthy",
  "checks": {
    "disk": { "status": "healthy", "freeGb": 450 },
    "memory": { "status": "healthy", "usedPct": 0.65 },
    "indexes": { "status": "healthy", "loaded": 12 },
    "replication": { "status": "degraded", "lagMs": 150 }
  },
  "version": "1.2.3",
  "uptime": "5d 12h 30m"
}