Dashboard Analytics
Monitor your MLGraph cluster in real-time with comprehensive metrics, health indicators, and performance tracking.
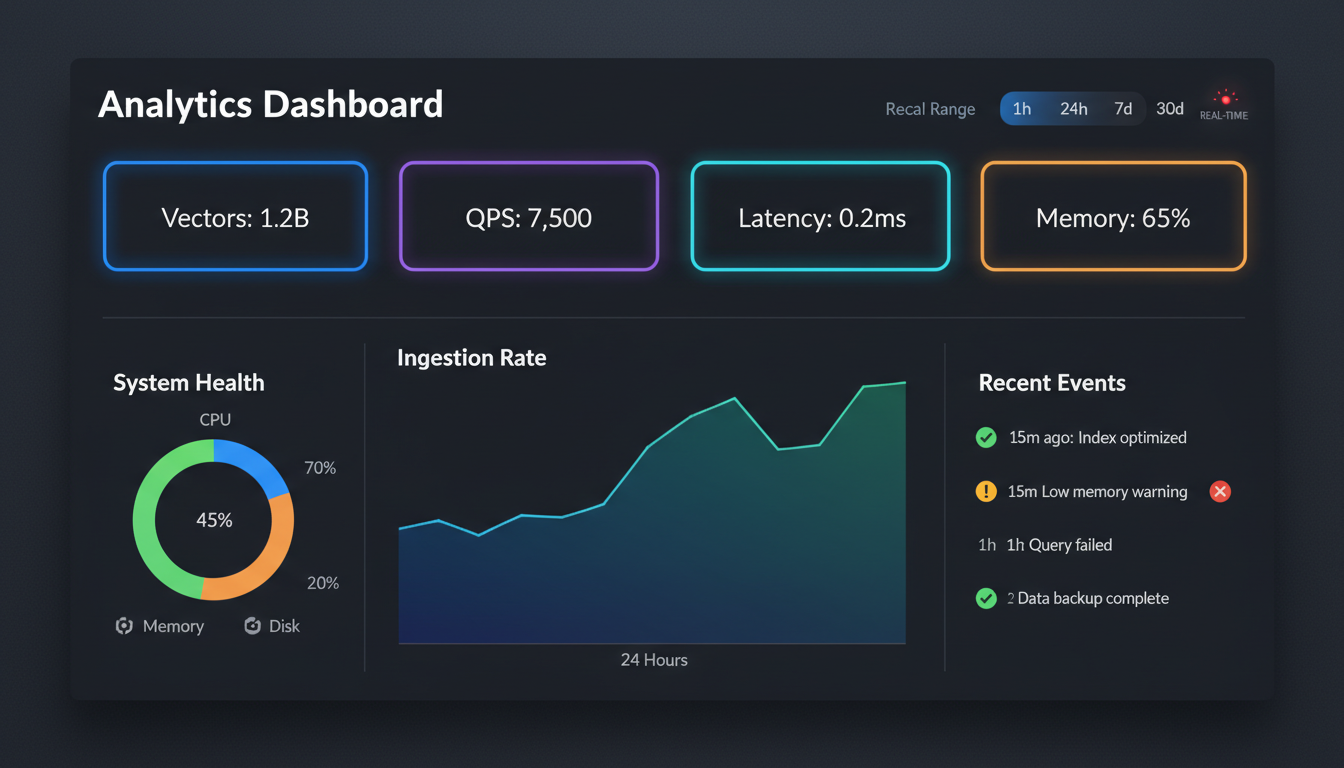
Real-time dashboard with metric cards, charts, and system status
Overview
The MLGraph dashboard provides a unified view of your entire cluster's health and performance. All metrics update in real-time via WebSocket connections, giving you instant visibility into system behavior without manual refresh.
Metric Categories
System Health
- • Node status (online/offline/degraded)
- • CPU and memory utilization per node
- • Disk space and I/O metrics
- • Network latency between nodes
Index Metrics
- • Total vectors across all indexes
- • Shard distribution by type
- • Training status and progress
- • Merge queue depth
Performance
- • Queries per second (QPS)
- • P50, P95, P99 latency
- • Ingest throughput (vectors/sec)
- • Cache hit rates
Operations
- • Active background jobs
- • Replication lag by mirror group
- • Scheduled maintenance windows
- • Recent alerts and events
Chart Types
The dashboard uses a variety of chart types to visualize different metrics effectively:
- Time Series Charts
QPS, latency, and throughput over time with configurable windows (1h, 6h, 24h, 7d)
- Distribution Histograms
Latency distributions, vector count per cluster, shard sizes
- Heatmaps
Node-to-node latency matrix, cluster load distribution
- Gauge Charts
Resource utilization, health scores, capacity remaining
Real-time Updates
All dashboard metrics are pushed via WebSocket, providing sub-second updates. The connection automatically reconnects on network issues and shows connection status in the header.
// WebSocket metric subscription
const { metrics, connected } = useMetricsWebSocket({
  endpoint: '/ws/metrics',
  channels: ['system', 'indexes', 'performance'],
  updateInterval: 1000, // ms
});

// Use in dashboard
<MetricCard
  title="Queries/sec"
  value={metrics.qps}
  trend={metrics.qpsTrend}
  status={connected ? 'live' : 'stale'}
/>